- java.lang.Object
-
- org.shared.stat.plot.Histogram
-
- All Implemented Interfaces:
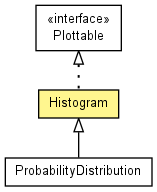
- Plottable
- Direct Known Subclasses:
- ProbabilityDistribution
public class Histogram
extends Object
implements Plottable
A representation of histograms.
-
-
Field Summary
Fields Modifier and Type Field and Description protected RealArray[]datasetsThe datasets.protected DataStyle[]dataStylesTheDataStyles.protected String[]dataTitlesThe data titles.protected double[]xrangeThexrange.protected double[]yrangeTheyrange.
-
Constructor Summary
Constructors Constructor and Description Histogram(double min, double max, int nBins, double[]... valuesArray)Default constructor.
-
Method Summary
Methods Modifier and Type Method and Description double[]getAxisRange(Plot.AxisType axisType)Gets the axis range.StringgetAxisTitle(Plot.AxisType axisType)Gets the axis title.RealArray[]getDatasets()Gets the datasets.DataStyle[]getDataStyles()Gets theDataStyles.String[]getDataTitles()Gets the data titles.StringgetTitle()Gets the title.booleanisPropertyEnabled(String property)Gets whether the given property is enabled.
-
-
-
Field Detail
-
datasets
protected final RealArray[] datasets
The datasets.
-
dataTitles
protected final String[] dataTitles
The data titles.
-
xrange
protected final double[] xrange
Thexrange.
-
yrange
protected final double[] yrange
Theyrange.
-
-
Constructor Detail
-
Histogram
public Histogram(double min,
         double max,
         int nBins,
         double[]... valuesArray)
Default constructor.- Parameters:
min- the range minimum.max- the range maximum.nBins- the number of bins.valuesArray- the array of values.
-
-
Method Detail
-
getDatasets
public RealArray[] getDatasets()
Description copied from interface:PlottableGets the datasets.- Specified by:
getDatasetsin interfacePlottable
-
getDataTitles
public String[] getDataTitles()
Description copied from interface:PlottableGets the data titles.- Specified by:
getDataTitlesin interfacePlottable
-
getDataStyles
public DataStyle[] getDataStyles()
Description copied from interface:PlottableGets theDataStyles.- Specified by:
getDataStylesin interfacePlottable
-
isPropertyEnabled
public boolean isPropertyEnabled(String property)
Description copied from interface:PlottableGets whether the given property is enabled.- Specified by:
isPropertyEnabledin interfacePlottable- Parameters:
property- the given property.- Returns:
trueif and only if the given property is enabled.
-
getAxisRange
public double[] getAxisRange(Plot.AxisType axisType)
Description copied from interface:PlottableGets the axis range.- Specified by:
getAxisRangein interfacePlottable- Parameters:
axisType- thePlot.AxisType.
-
getAxisTitle
public String getAxisTitle(Plot.AxisType axisType)
Description copied from interface:PlottableGets the axis title.- Specified by:
getAxisTitlein interfacePlottable- Parameters:
axisType- thePlot.AxisType.
-
-